Page Speed Testing
I use speed testing tools every day of the week. I am constantly looking at ways not only to make my website fast but my clients’ sites too. I also use it to look at your website and see how your site is performing.
If you know how to use them, understand what is being shown then you can get to the bottom of any speed issue with your (or your clients) website using Page Speed tools.
Over the next few blog posts, I am going to be looking at the various tools that I use and explaining how the information helps me find the cause of sites that run slow.
There are many online tools out there to scan your site and give you some great stats. We regularly use:
- GTMetrix
- Pingdom
- Pagelocity
This is the first in a series of blog posts looking at speed testing tools, in this one I going to be looking at TTFB – Time To First Byte.
TTFB – Time To First Byte
I use GTMetrix for one particular result, the Page Load Timings chart, just like the one shown below:

What I am looking at is the TTFB box. So what is TTFB? GTMetrix’s own description of TTFB is:
“Time to First Byte (TTFB) is the total amount of time spent to receive the first byte of the response once it has been requested. It is the sum of “Redirect duration” + “Connection duration” + “Backend duration”. This metric is one of the key indicators of web performance.
In the Waterfall Chart, it is calculated at the start of the test until just before receiving on the page request and represented by the orange line.
Some ways to improve the TTFB include: optimizing application code, implementing caching, fine-tuning your web server configuration, or upgrading server hardware.”
In essence, this is the time it takes to get the first byte of data from the server to the browser requesting it.
If the TTFB is high then in our experience the site is probably on a poorly performing host. The issue could be anything from the physical hardware, the network, or the server being too highly utilised.
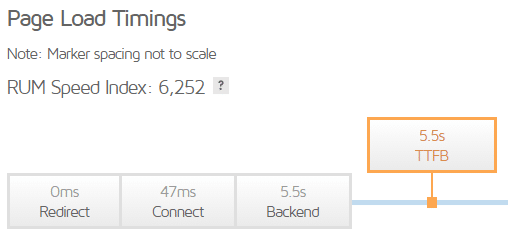
The result below is from a site we were recently asked to test, as you can see the TTFB is 5.5 seconds

What that means is that it took the server over 5 seconds to respond to the request for the site and send data back to the browser – 5 seconds!!!
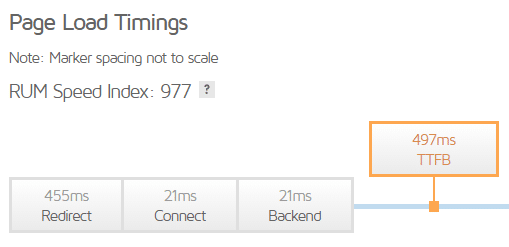
I took a backup of this site and I moved it onto our shared platform, optimised the site and ran the test again. The result is below:

The TTFB is less than 500ms or less than half a second.
The improved results could have been due to any or all of the following:
- Implementing caching
- Optimising the images
- Using an SSL and HTTP/2
- Implementing gzip
- Migrating the site to our platform
If your site is running slow I would suggest that the first thing you do is implement caching, ensure all your plugins are up to date, implement an SSL and ensure that HTTP/2 is supported, use gzip and use PHP version 7.
Implementing all the above will ensure that the issue with the speed of the site is not the application, caching or code. Run the test again and if you still get a low TTFB then it could be time to look at an alternative host. You could also look at implementing a CDN to help with the speed.
You can use GTMetrix for free – if you want to choose the location for the test and save any results you need to register for a free account, just visit https://gtmetrix.com
Need some help?
If you are experiencing issues with the speed of your site and want some assistance then why not contact us? We will happily run a test and make recommendations, just click the button below:
Contact Us


